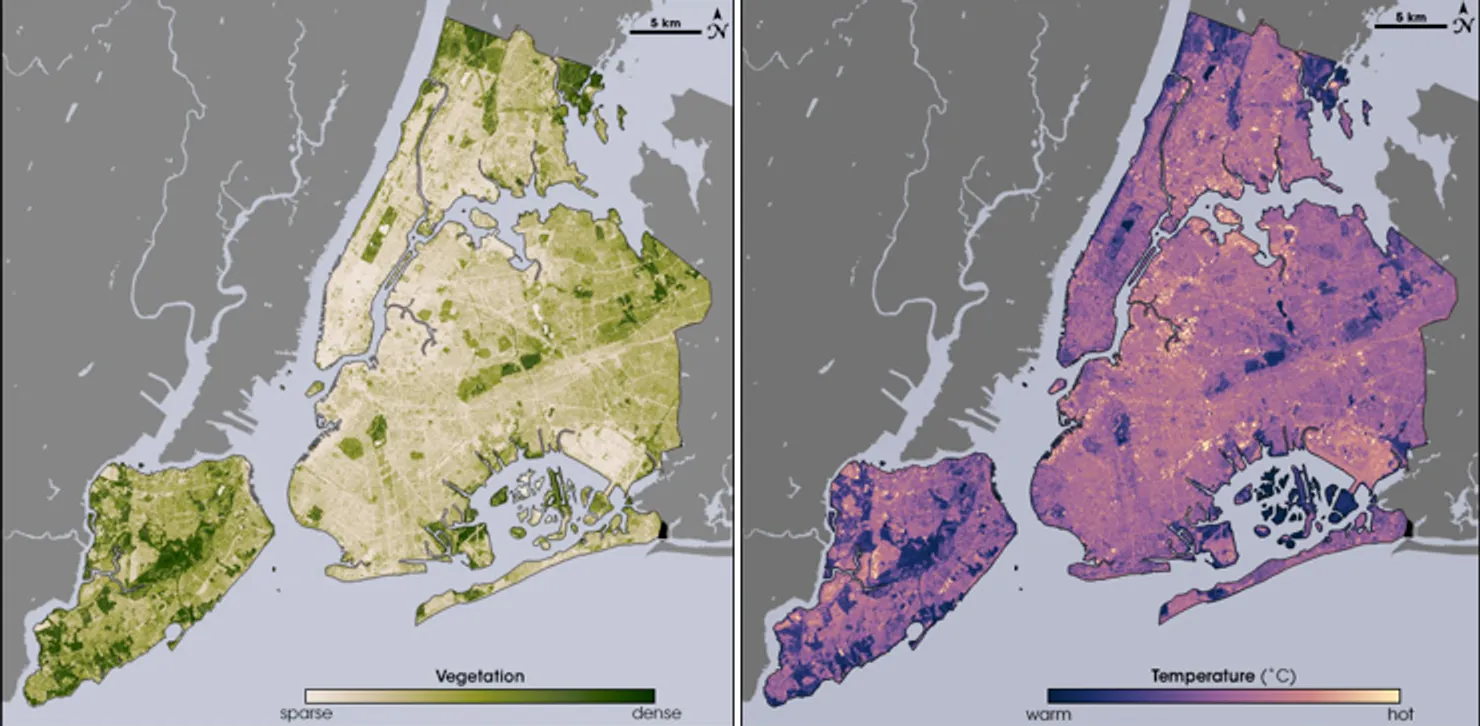
Landsat thermal imagery shows how differently sunlit surfaces can warm up within the same city.
Article
Step out of a building’s shade and cross a dark parking lot at midday, and the heat beneath your feet and against your face can change. Landsat surface-temperature maps show from above how roofs, roads, and vegetation differ in temperature. Color makes the contrast between parks and large paved areas easier to see.
The US Geological Survey produces Landsat surface-temperature data using thermal infrared signals received by the satellite, among other inputs. The mapped temperature is that of the surface at the time of the satellite’s pass. It differs in both what and when it measures from air temperature at human height or a daily average. The same place can therefore appear in different colors on different observation dates.
The New York illustration in this article shows the same area through two datasets: vegetation density and surface temperature. In this NASA example, areas of dense vegetation visibly overlap with relatively cooler surfaces. The relationship becomes apparent when the maps are viewed together. A temperature map alone cannot show whether a cool area contains trees.
Shade, the release of moisture by plants, and paving materials can all influence the differences. A treeless area is not always the hottest. The timing of shadows from buildings and whether rain fell before an observation can also affect the result of a single image.
An investigation can begin by locating color differences on a satellite map and then examining the places they represent. Two blocks with the same mapped temperature might contain a large parking lot and a street of low buildings. Checking those differences on the ground can help establish where shade is lacking and what needs closer study.
To understand urban heat, repeated high readings from particular paved areas or buildings under comparable conditions can be more informative than finding the reddest spot on one day. Even the short walk between a neighborhood park and its parking lot crosses a succession of different surfaces on a satellite map.
Sources and editorial notes
www.usgs.gov · Official source
www.usgs.gov · Official source
Editorial note: Factual statements are based on the sources above; interpretations reflect MUADAILY’s editorial perspective. Image: NASA / USGS Landsat.
Machine-translated from Korean. Read the original.