Hand-drawn postcards and temperature stripes share a gallery. Two works offer a way into MoMA’s exhibition of information design.
Article
A postcard can tell a friend about last week without showing a holiday view. Dots and lines record everyday observations, with a key on the back. For Dear Data, Giorgia Lupi and Stefanie Posavec drew and exchanged information about their lives for a year. New York's Museum of Modern Art includes part of the project in an exhibition about information design.
Each week, the two chose a subject and observed their routines. They collected data, drew it on postcard-sized paper, and mailed it across the Atlantic. The recipient could read the picture and its legend to understand a friend's week. Recording and decoding were deliberately slower than numerical processing.
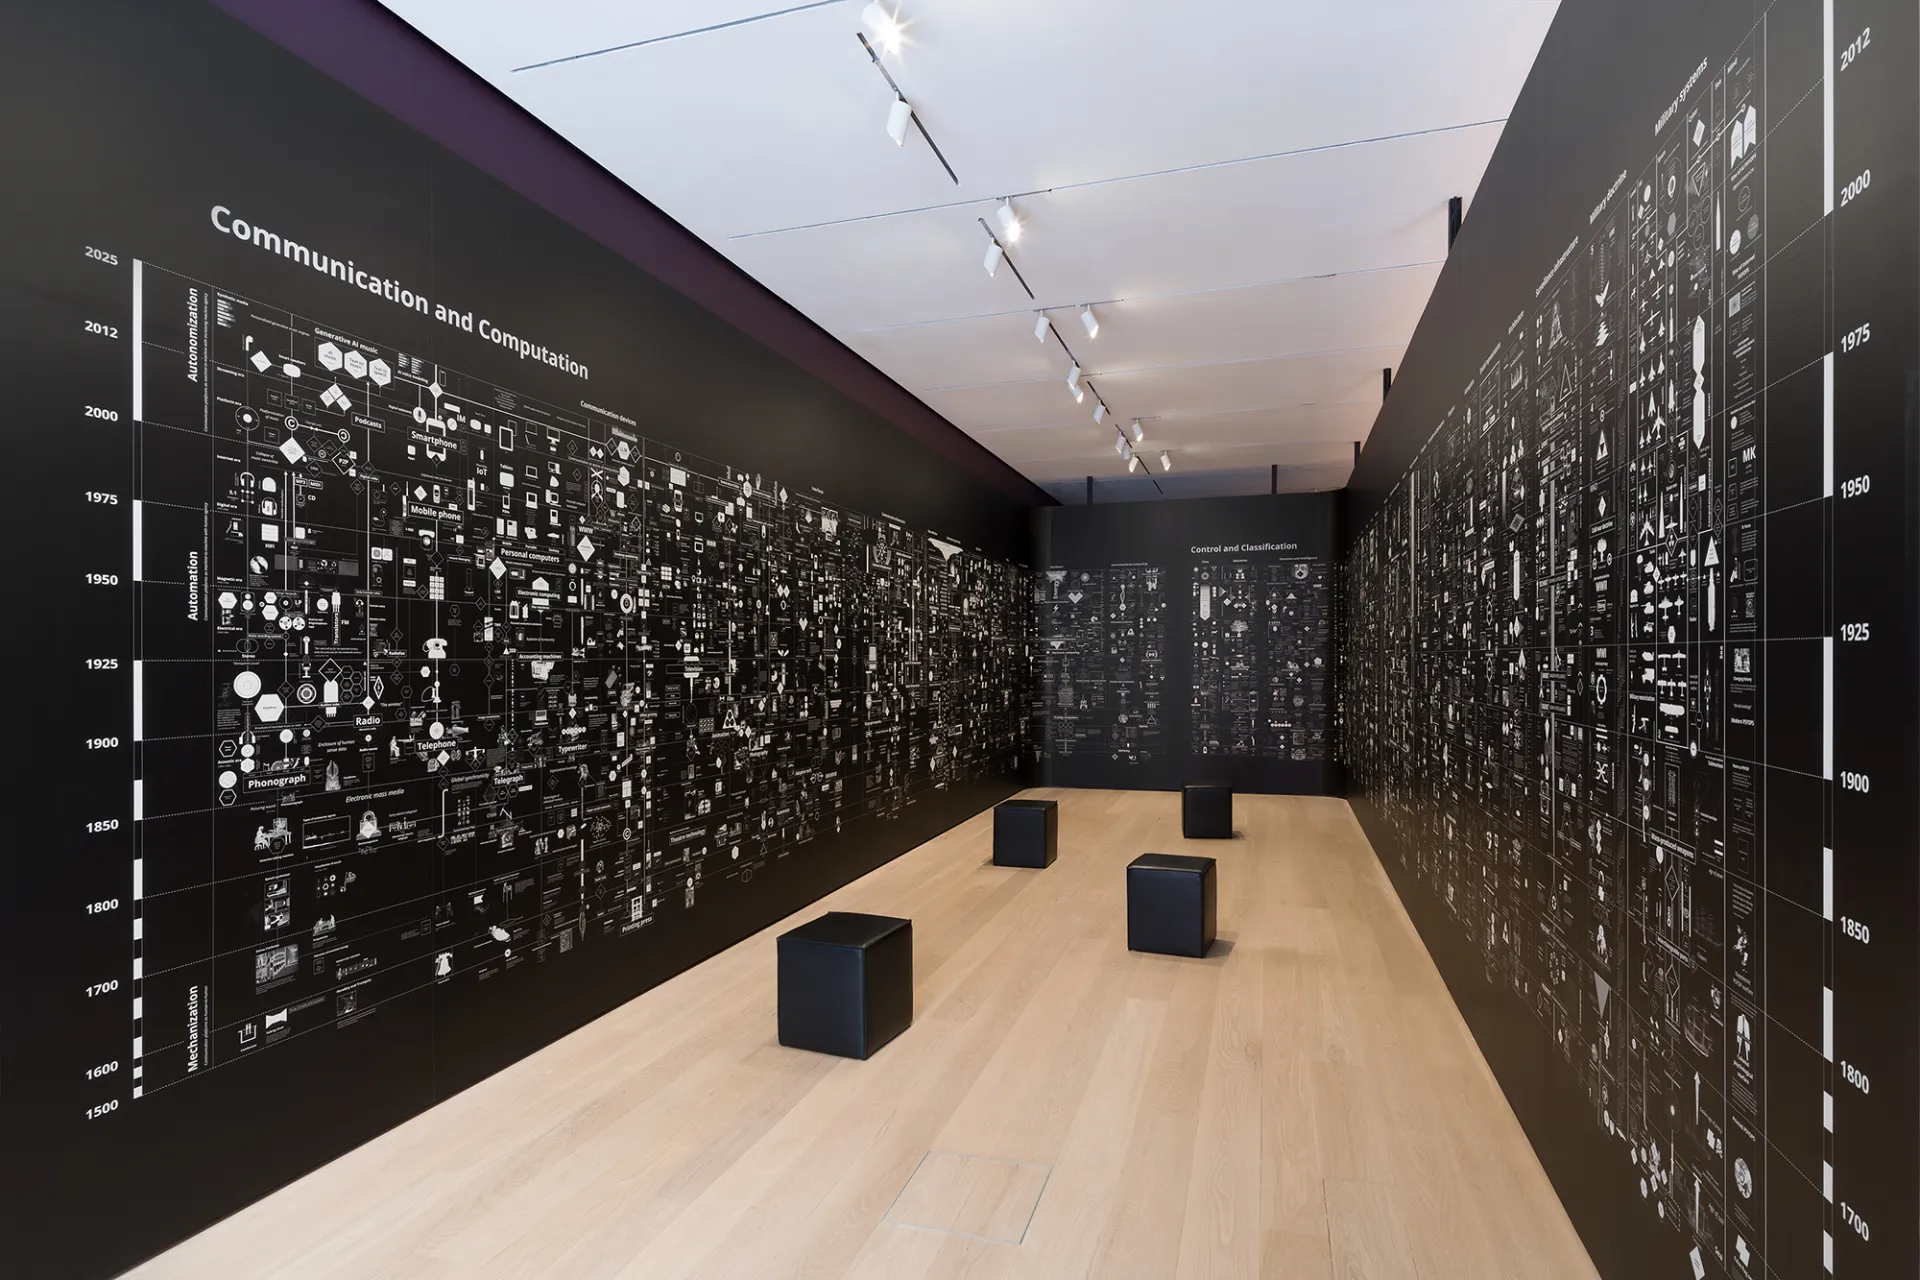
MoMA's Full Disclosure: The Edge of Information Design brings together 30 works, from analog to digital. It runs from September 27, 2026, to June 13, 2027, in a free street-level gallery. It is MoMA's first exhibition devoted entirely to information design, asking how statistics and records are made visible.
Ed Hawkins's Warming Stripes works at a very different scale. Colored bands represent changing annual average temperatures, one stripe per year. The sequence of blues and reds makes a long-term pattern immediately visible. The version in the exhibition covers 1850 through 2025, rather than the weather of a single day.
The two works change the order in which information is encountered. A postcard's pattern is seen before its meaning is decoded. Climate stripes reveal a long trend before inviting closer attention to individual years and values. The same table or list of numbers is not the only way to communicate data; the format changes what is noticed first.
A simplified picture still needs explanation. Reading it requires knowing the color scale, the period covered, and what was counted. That is why Dear Data includes a key on the back. Reducing information to a visual form involves choosing what to keep and what context to place beside it.
These choices appear outside museums too, in calendars, expense records, news charts, and phone screen-time reports. MoMA presents more than quantities of data: it shows how a friend's week or long-term planetary change can become readable forms. Knowing where a dot or stripe comes from reveals the observations behind an apparently simple picture.
Sources and editorial notes
MoMA · Full Disclosure official exhibition introduction
Checklist of MoMA · Full Disclosure exhibition works
Dear Data · Author's project description
University of Reading · Warming Stripes Commentary
Editorial note: Facts were checked against the sources above; interpretations reflect MUADAILY’s editorial perspective. Image: Photo by Robert Gerhardt © The Museum of Modern Art, New York.
Machine-translated from Korean. Read the original.